
How I made dependency injection in Python 130× faster: from reflection to compiling the graph
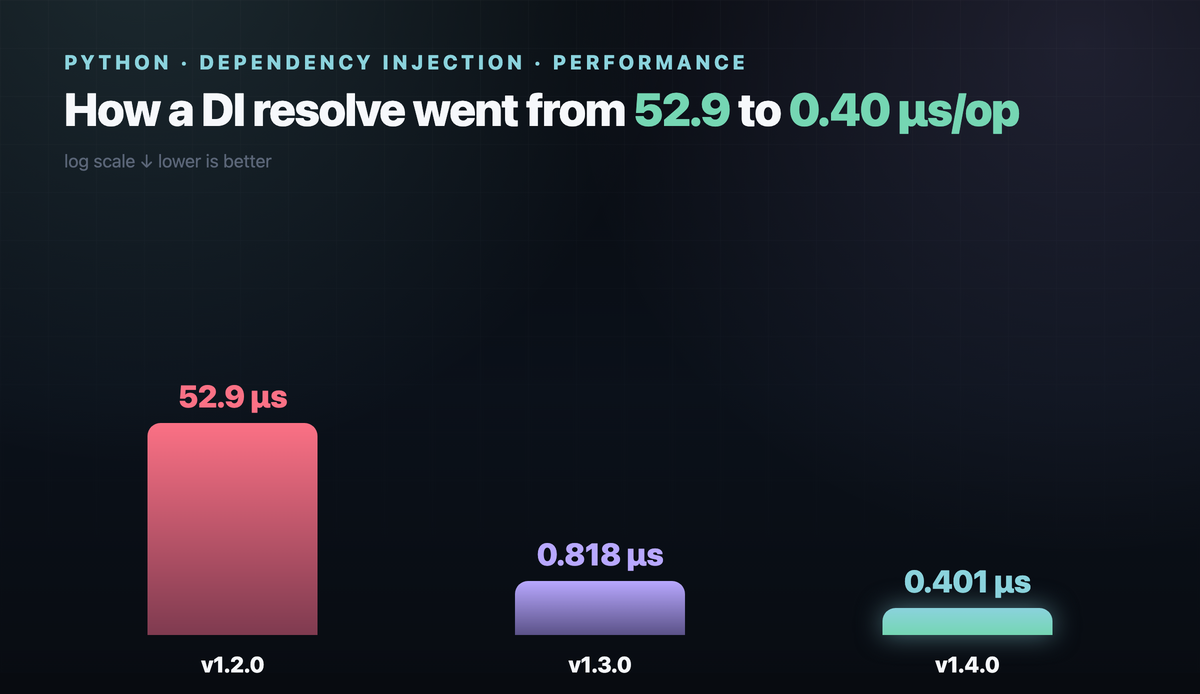
From ~53 µs/op to 0.40: caching the plan, cutting a check that can't fire, and compiling the dependency graph — a number at every step.

There's a stock argument against DI containers in Python: a container is just overhead, pass the dependency into the constructor yourself and stop overengineering. It sounds reasonable, and I believed it for a long time. But "sounds reasonable" isn't a number, so at some point I sat down and measured: what does a container actually cost on every resolve, and can you even catch up to hand-wiring without breaking the semantics?
Short version: you can get very close. But the number isn't really the point — the road there is, because most of the steps are tricks that pay off well beyond DI: spotting overhead that's invisible in a single call, deleting code that provably never runs, and keeping exec-based codegen from quietly breaking production along the way.
The setup
The graph is small but typical for a backend: singletons on top (config and a client), transient repository, email sender and audit below, and a RegisterUser use case that pulls all three. The benchmark resolves this graph in a loop; next to it, as a lower bound, the same objects built by hand. Same machine for every measurement. The numbers are synthetic and tied to the shape of the graph — this is not a universal ranking of containers, it's a reproducible check of one shape, and the script is open.
The starting point was sobering: by hand — 0.27 µs/op, the naive container — 52.9. Almost two hundred times slower. For reference, punq — a real reflection-based container — does about 57 µs/op on the same graph, so the number isn't made up. That's just what you get if you inspect constructors on every resolve.
Where 53 microseconds come from
The naive resolver reaches into the constructor on every call: it takes inspect.signature, calls get_type_hints, recursively resolves the dependencies from the annotations, and constructs the object. The problem is that get_type_hints and signature parsing are expensive — annotation evaluation, MRO walking, allocations. Once, it's nothing. A million times in a row, it's those tens of microseconds.
The obvious move: parse the graph once. At registration (or on the first resolve) you read the constructor and store a "plan" — which dependencies, in what order, with what lifetime. After that, resolving follows the plan, with no signature or get_type_hints at all.
That one change removes almost all of the cost: 52.9 → 0.818 µs/op, roughly 65×. And then comes the part people usually leave alone. They shouldn't.
Twist one: a check that could never fire
With the plan cached, every "fast" constructor was wrapped in a cycle guard:
def create(scope):
    if cls in resolving:                 # cycle guard
        raise CyclicDependencyException(cls)
    resolving.add(cls)
    try:
        return cls(dep0(scope), dep1(scope))
    finally:
        resolving.remove(cls)
A set lookup, an insert, a try/finally — per node, per resolve. Looks mandatory. But here's the catch: a fast constructor is only built when the subgraph is already proven acyclic. While building the plan, the moment it hits a cycle the compiler returns None, and that graph falls back to the slow, interpreted path — which is where the guard lives. So on the fast path, cls in resolving can never become true.
It's a guard that physically cannot fire. I removed it from the fast path; cycle detection stays where it actually works — in the interpreter and in a separate graph-validation step. A cyclic graph simply never gets a fast constructor and is caught as before. The takeaway: if an invariant is already guaranteed earlier in the code, re-checking it at runtime just costs you. A few percent, for free.
An allocation on every call
The profiler flagged one more small thing that's expensive because of how often it happens. resolve(SomeType) for the most common case — resolve by type, no name, no scope — built a key tuple (interface, None) and read a couple of registration attributes. Nanoseconds per call, but there are millions of calls. A direct type → constructor dict for that case (cleared when registrations change or a test override kicks in) gets rid of both the tuple allocation and the extra reads.
Twist two: compile the graph — and nearly break production
The biggest reserve was in the shape of the fast path itself. A transient graph was built as a tree of nested closures: resolving the use case called the use-case closure, which called the repository closure, which called the singleton client's getter. One function call per node. Worse, a shared singleton needed by two siblings was fetched twice.
The classic fix: glue the whole transient chain into one flat function — inline the constructors and compute each shared singleton once instead of twice. This is exactly what compilers call common-subexpression elimination (CSE).
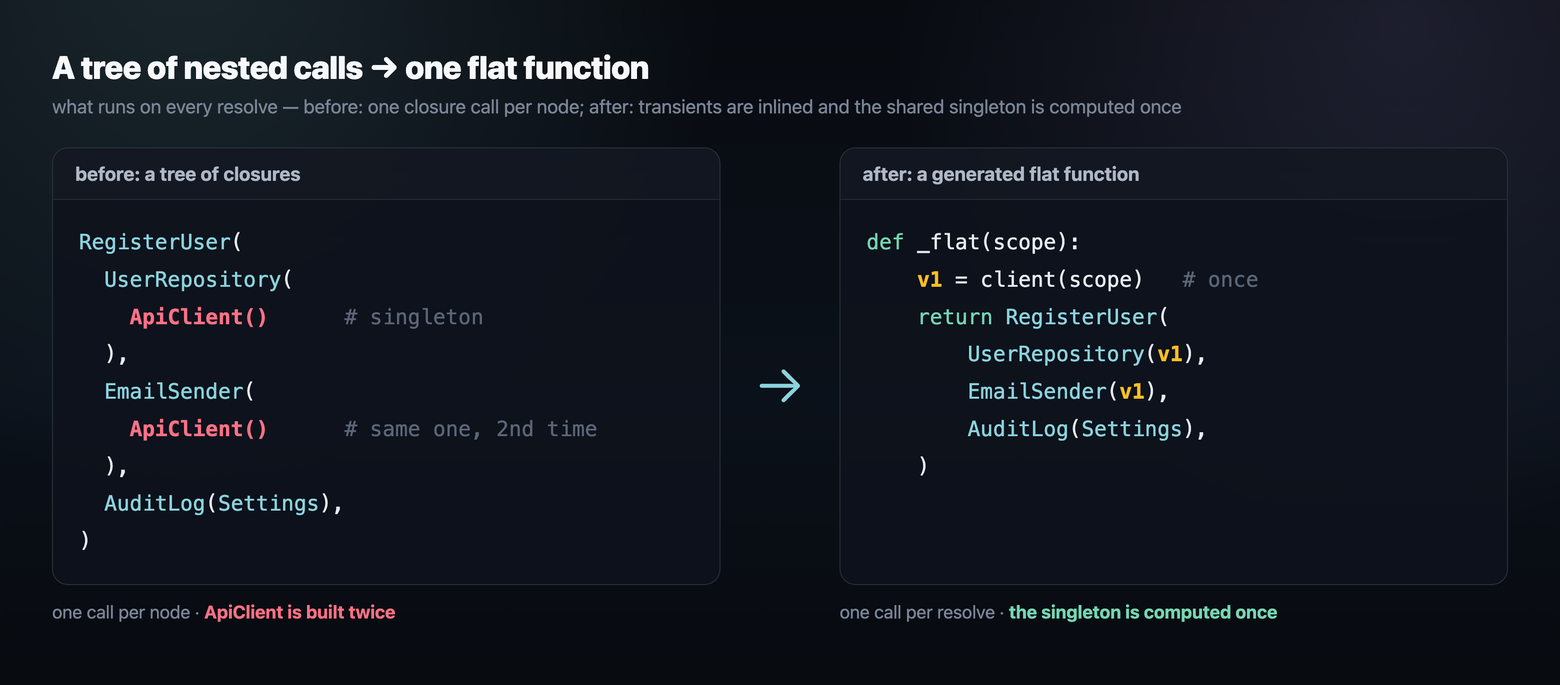
Mechanically it's code generation: from the graph's plan I build the source of a function and bring it to life through exec inside a closure with the needed symbols. The leaves — singletons, scopes, instances — stay as the previous constructors (I don't touch their caching or lazy creation, I reuse them as-is); only the transient part becomes flat, which is exactly what runs on every resolve. Not a single class name or user value goes into the generated source — only opaque generated symbols, so there's nothing to inject through it.
That gave the main win: 0.818 → 0.401 µs/op. From the naive version, that's about 130×, and the container now trails hand-wiring by less than 1.5×.
And this is where I nearly stopped. exec-based code generation in a library is a special kind of risk. A bug in it doesn't fail with a stack trace. It quietly builds the wrong object in someone's production: hands you the wrong implementation, loses a shared singleton, swaps argument order. For DI, that's the worst case — "works, but wrong."
So I didn't ship it on vibes. I did the thing I'd recommend to anyone touching code generation: equivalence fuzzing. The idea is simple: generate thousands of random acyclic graphs with mixed lifetimes, optional and default parameters; resolve each one two ways — the compiled path and a separate, deliberately dumb reference resolver; and compare not the values, but the structure of the result. The same classes, and the same pattern of shared references — where a singleton must be the same object and a transient must be different ones.
4000 random graphs — the structure matched on every one
Whatever the compiler can't handle — factories, property injection, injecting the container itself, cycles — it honestly returns None and falls back to the old path. That harness, not "looks right," is the reason exec-generated code made it into a release at all. If you build something similar: a separate reference plus a structural comparison is worth more than a hundred hand-written tests.
Honest limits
So I don't oversell it. The numbers are synthetic and tied to the shape of the graph: with lots of scopes, async resources, or factories the picture is different — run it on yours. And if your wiring is mostly about async resource lifecycles or rich scopes — opening and closing pools or sessions as part of resolution — that's a different design with real merits, and libraries like dishka and dependency-injector are built for exactly that; this one isn't. The flat compilation speeds up exactly transient chains with shared singletons; if you're mostly factories or property injection, there's no win, because those nodes go down the interpreted path anyway. And below ~0.4 µs in pure Python without a C extension you can't meaningfully go: the next step is Cython, and that's a different conversation about dependencies.
Wrap-up
| Version | Resolve, µs/op | What changed |
|---|---|---|
| by hand | 0.271 | lower bound |
| naive container | 52.9 | reflection on every resolve |
| + cached plan | 0.818 | parse constructors once |
| + flat function, CSE, dispatch dict | 0.401 | compiling the graph |
Three things stuck with me from this one:
- Measure first. "Containers are expensive" was intuition; the number (200× slower than hand-wiring) showed where the cost actually sat, and that 99% of it goes away with one plan cache.
- Don't cling to code that provably never runs. Re-checking an invariant that's already guaranteed earlier is a cost with no upside.
exec-based codegen only behind an equivalence fuzzer. Silent wiring bugs are worse than crashes; a separate reference catches them in batches.
I did all of this on a small typed DI container I maintain — Injex, code and benchmark are open if you want the implementation details. But the techniques, not the library, are the point.
